The Trans-Alaska Pipeline System, often called the Alaska Pipeline, is a monumental feat of engineering that snakes its way across the vast, challenging landscape of Alaska. Mapping its route is crucial to understanding its environmental impact, operational logistics, and overall significance.
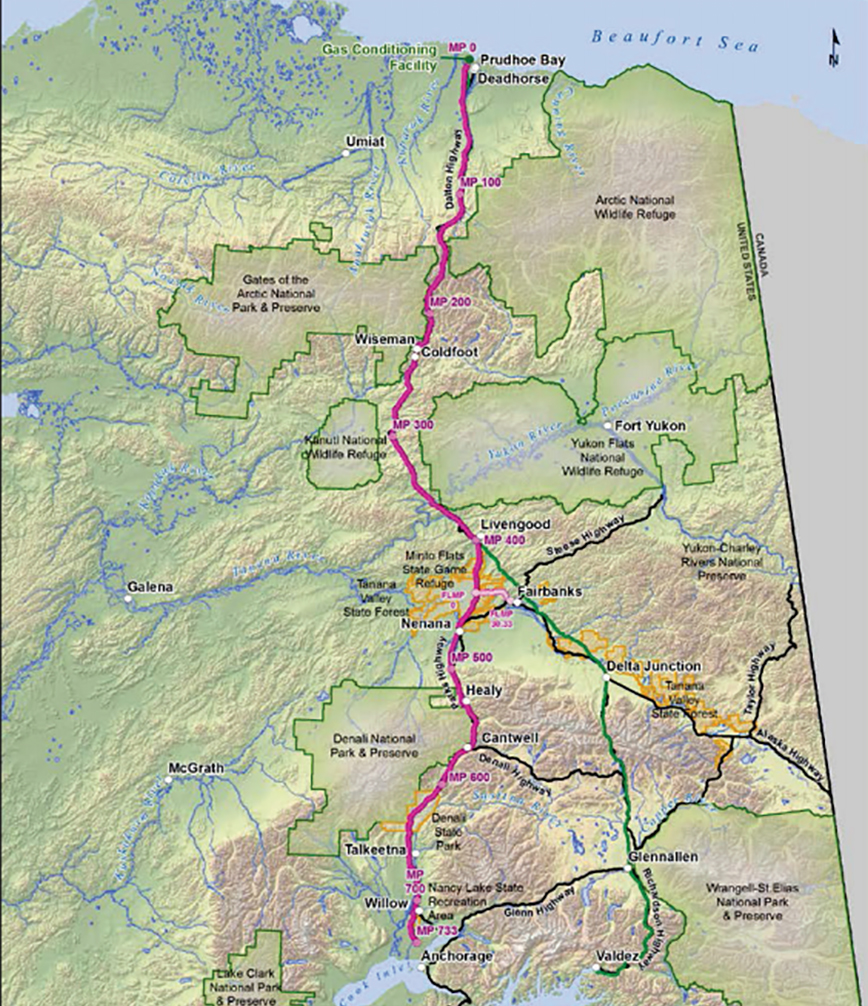
The pipeline’s journey begins in Prudhoe Bay, located on Alaska’s North Slope, along the Arctic Ocean. From here, it travels southward for approximately 800 miles (1,300 kilometers) to its terminus in Valdez, a port city on the south-central coast of Alaska, situated on Prince William Sound. Mapping this route reveals a dramatic traverse through diverse terrain.
Initially, the pipeline crosses the Arctic Coastal Plain, a flat, tundra-covered region characterized by permafrost. This presents a unique engineering challenge as the heat from the oil flowing through the pipeline could thaw the permafrost, leading to instability and potential damage. Consequently, large sections of the pipeline in this area are elevated above the ground on vertical supports. Mapping shows these elevated sections concentrated in the northern portion of the route.
As the pipeline moves south, it ascends the Brooks Range, a rugged mountain range that acts as a natural divide between the Arctic and interior Alaska. The pipeline winds through valleys and over mountain passes, demonstrating the engineering expertise required to navigate such difficult topography. Mapping the route here highlights the careful considerations made to minimize environmental disturbance and ensure the structural integrity of the pipeline.
South of the Brooks Range, the pipeline traverses the Yukon River Valley, a broad, flat region drained by the mighty Yukon River. The pipeline crosses the river using a specially designed bridge, an important landmark along the route. Mapping demonstrates the need for meticulous construction and maintenance in this area to withstand potential flooding and seismic activity.
Continuing southward, the pipeline enters the Copper River Basin, a region characterized by glacial landscapes, including the Chugach Mountains. Here, the pipeline is exposed to harsh weather conditions, including heavy snowfall and extreme temperature fluctuations. Mapping reveals how the pipeline route is carefully designed to avoid active glaciers and unstable terrain, minimizing the risk of damage from glacial movement.
Finally, the pipeline reaches Valdez, its southern terminus. At Valdez, the oil is loaded onto tankers for transport to refineries in the lower 48 states. The location of Valdez, with its deep-water port, is critical for the efficient and safe transport of Alaskan crude oil. Mapping the location of the terminal in relation to Prince William Sound highlights the environmental considerations that went into its construction and operation, especially in light of the 1989 Exxon Valdez oil spill.
In conclusion, a map of the Alaska Pipeline is more than just a line on a map. It’s a visual representation of a complex engineering project that has shaped the economic and environmental landscape of Alaska. It showcases the challenges overcome, the environmental considerations addressed, and the vital role the pipeline plays in transporting oil from the North Slope to the rest of the world.